Treemaps
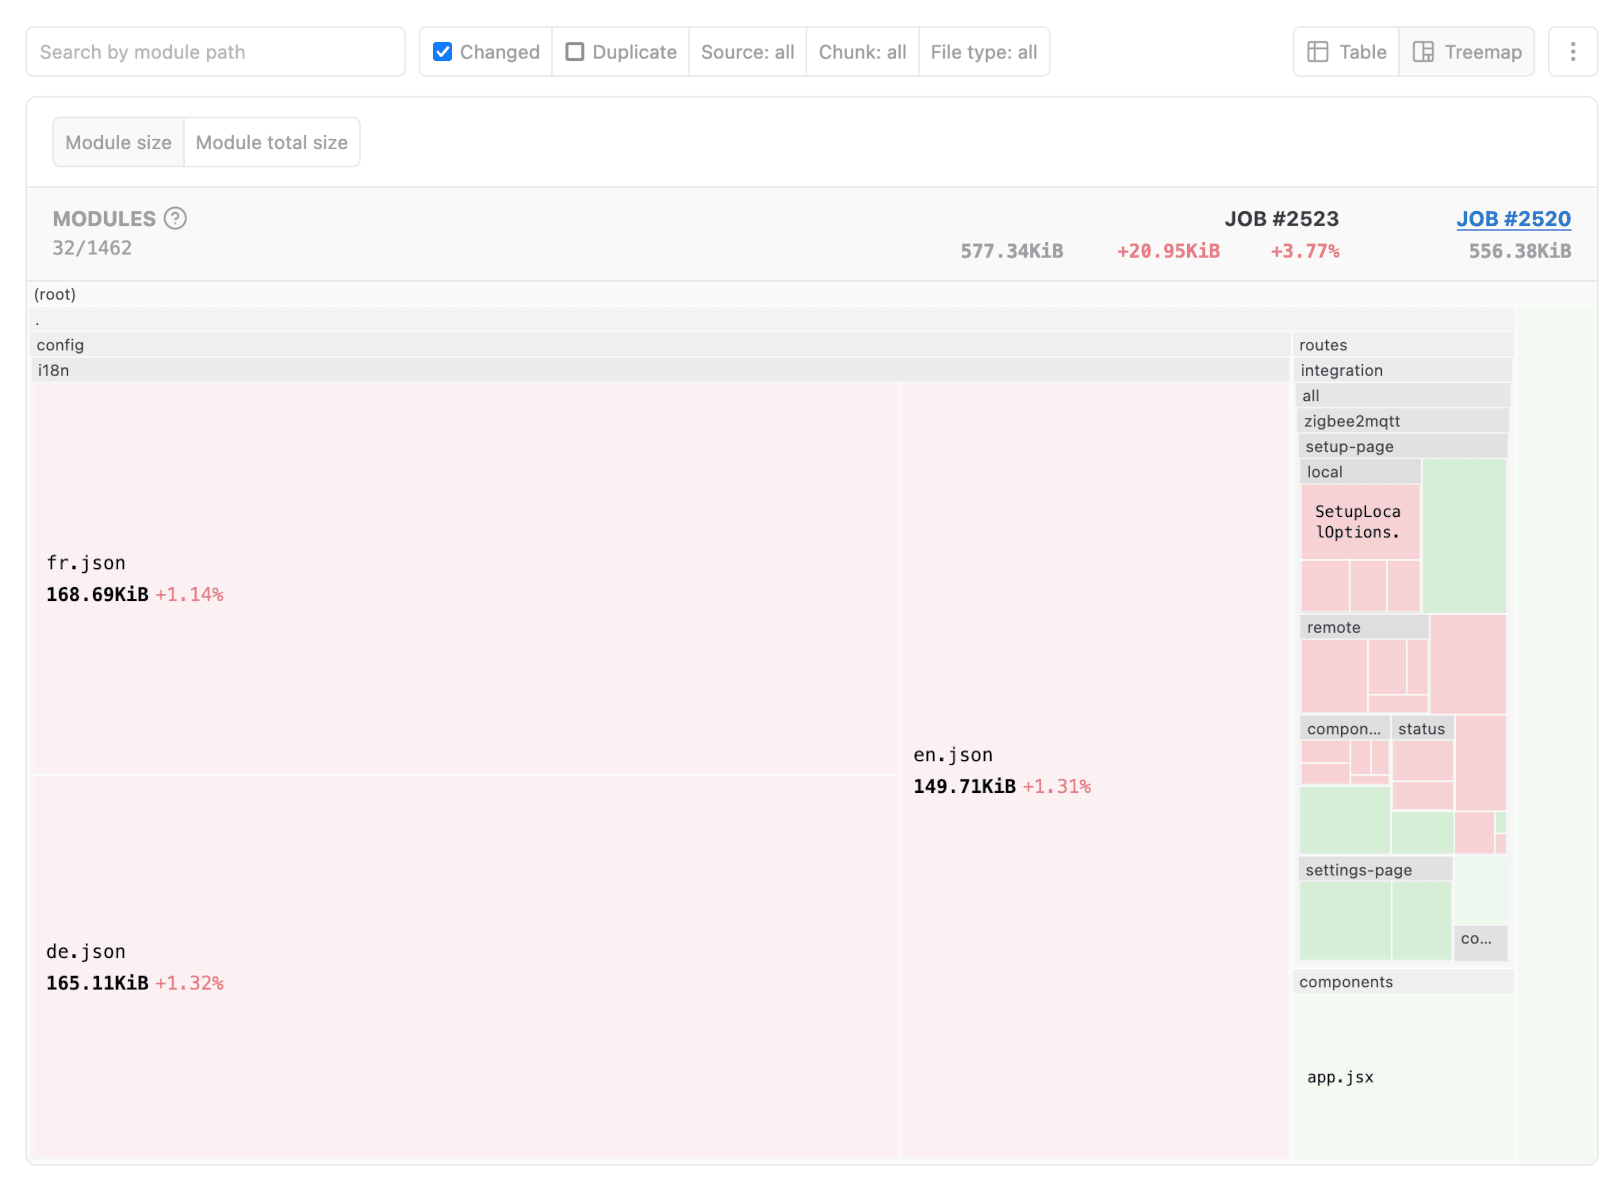
Treemap charts provide a visual representation of bundle structure and changes between builds. The charts are available for all the sections(totals, assets, modules, and packages) and display the data based on the existing filters.

For assets, modules, or packages, you can view the entries in a flat view or group them by folder. When the view is grouped by folders, you can focus on a particular area by clicking on the folder name to show the corresponding entries.
Metrics change type
Metric changes can quickly inform whether a code change has a positive or negative impact on the bundle. Some metric changes, such as assets count or module count, do not necessarily indicate regression or improvement, but reviewing these changes is helpful.
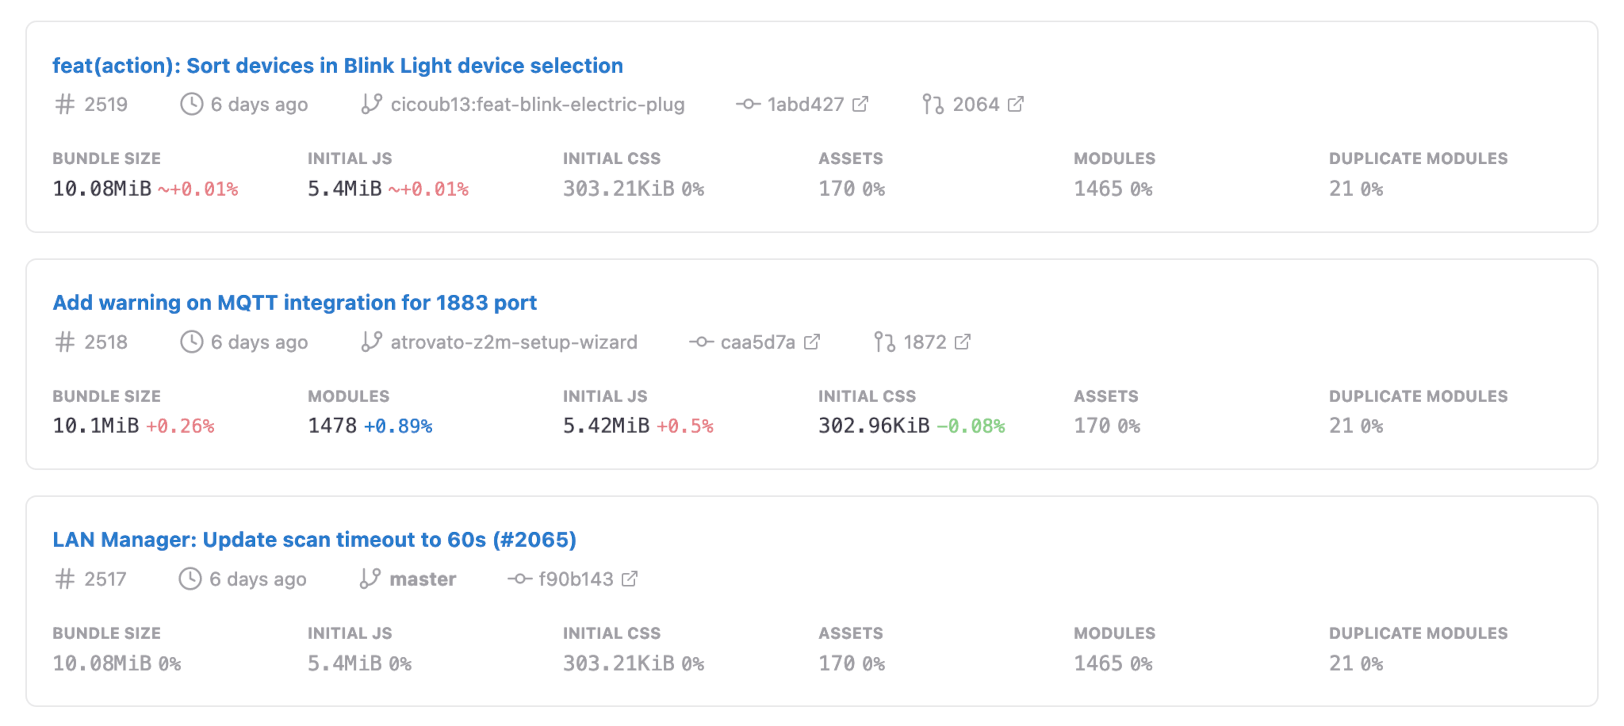
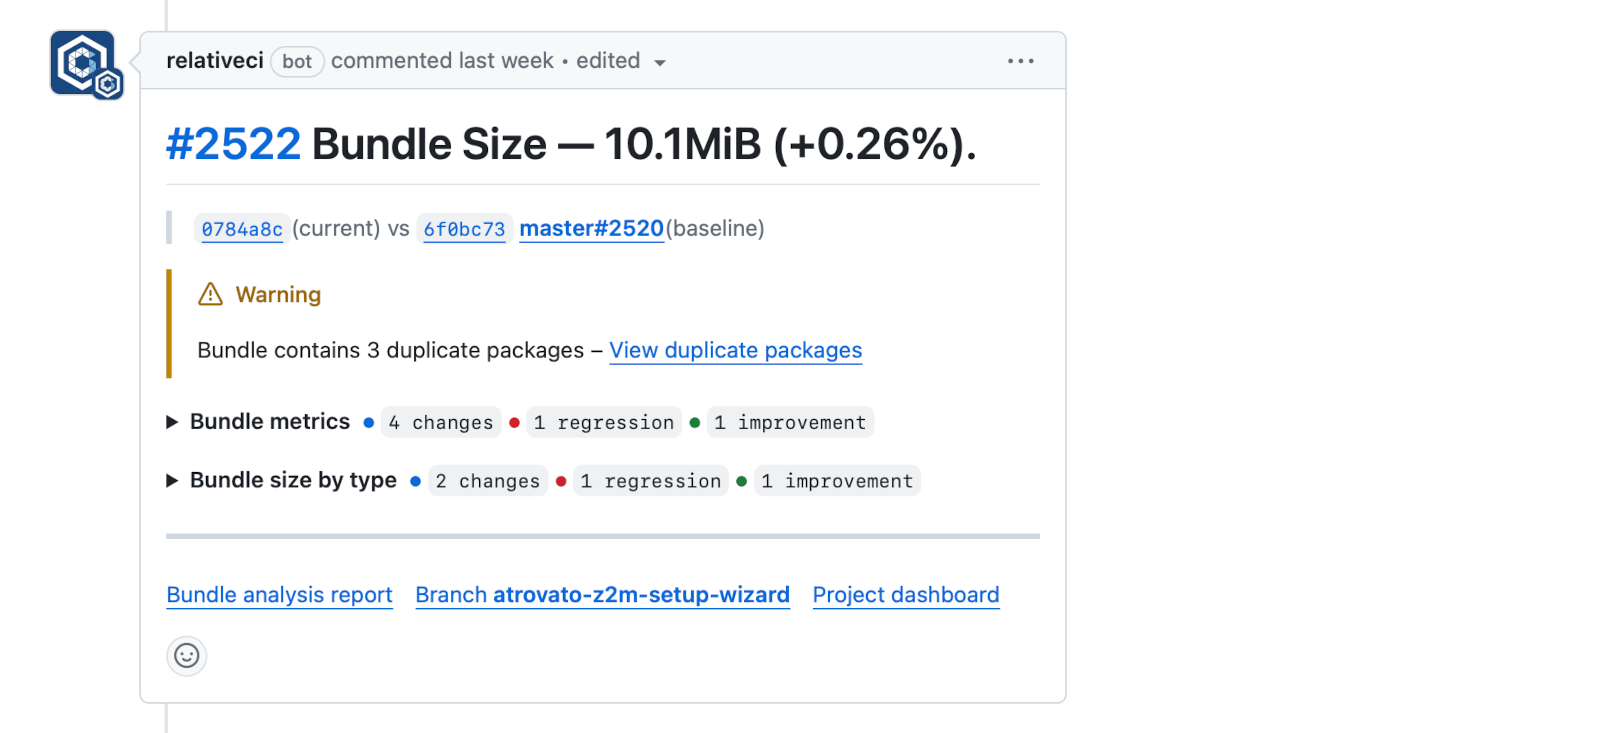
We are now showing the change type state on the job list and bundle analysis report(similar to the integration summary reports):
- green for improvement,
- red for regression
- blue for a neutral change
- gray for not changed


Others
- Change duplicate code metric difference to neutral
- Improve GitHub pull request number fallback
- Enhance integration summary reports
- Fix job compare error
- Enhance metric charts
- Fix job header
- Fix GitHub summary report icon contrast
- Enhance rule condition form
- Improve admin project listing
Package updates
Read more
Follow us on Twitter, subscribe to our mailing list or subscribe to our feed to stay up to date with RelativeCI updates.