Metric chart improvements
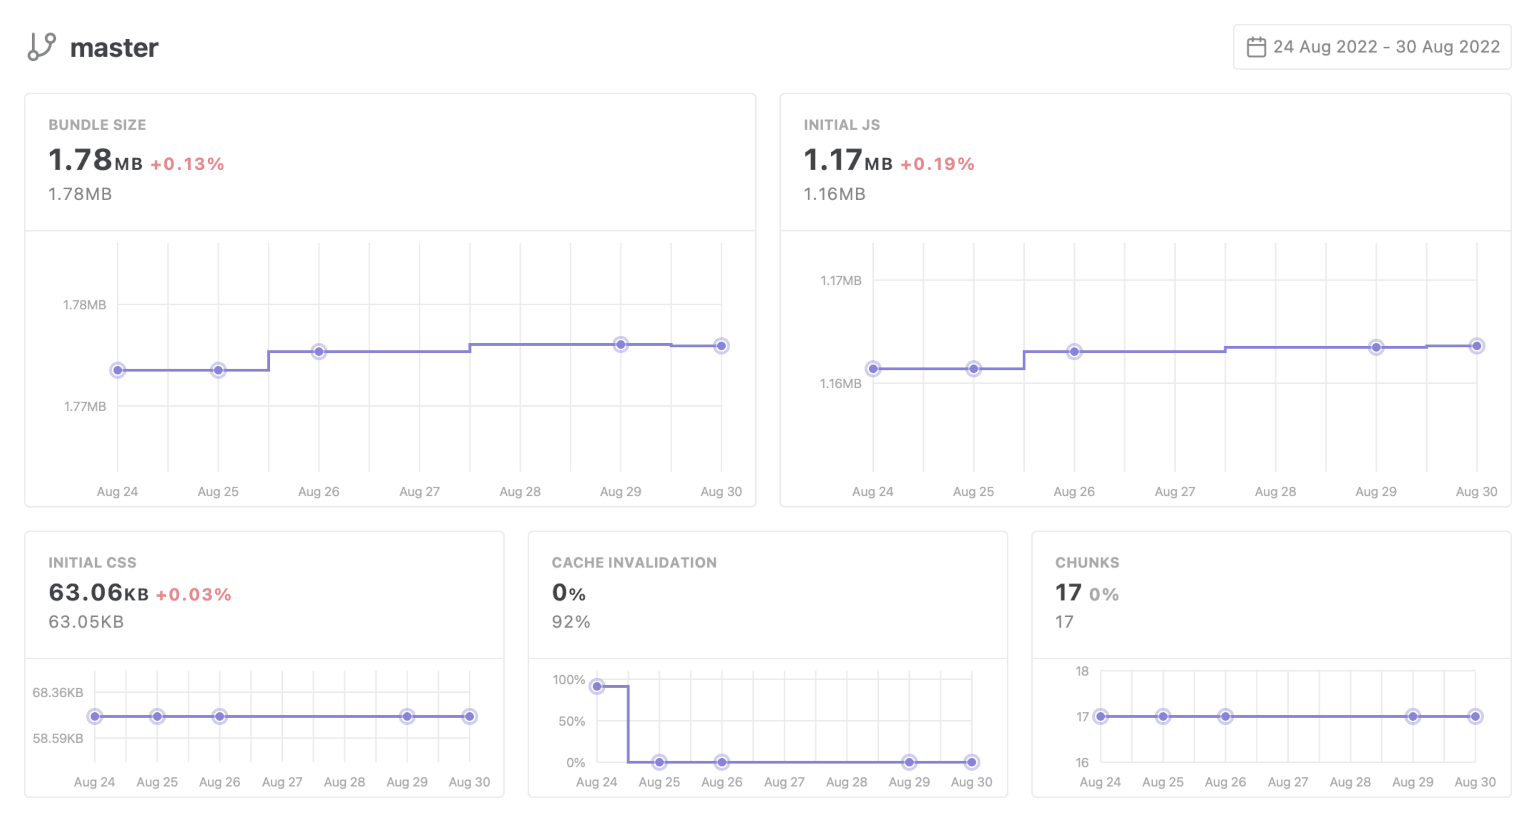
The project dashboard and branch view show individual metric charts, allowing us to easily identify any metric changes during the current period. The metric current and baseline values correspond to the last and the first job in the period.
Also, as a project member, you can use the select period date picker to choose a custom or extended period.

Interval details
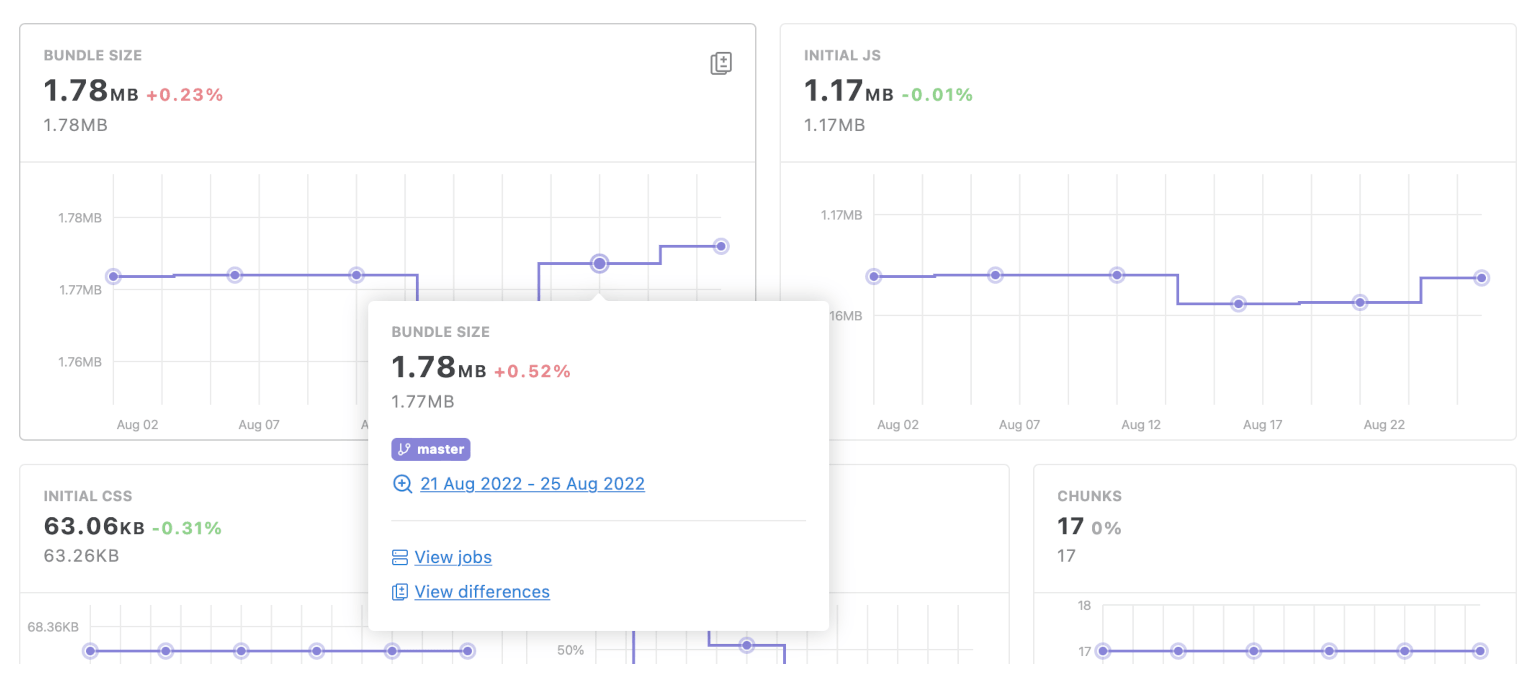
Every interval point shows a card with details on hover. The card displays the metric's value for the current interval, the previous interval(baseline), and the delta. Click on the "View jobs" link to navigate to the list of related jobs, or click on the "View differences" link to navigate to the corresponding metric section of a comparison between the last job in the current interval vs. the last job in the previous interval.
When the period is longer than one day, you can click on the interval link to change the period to the current interval.

Period job comparison
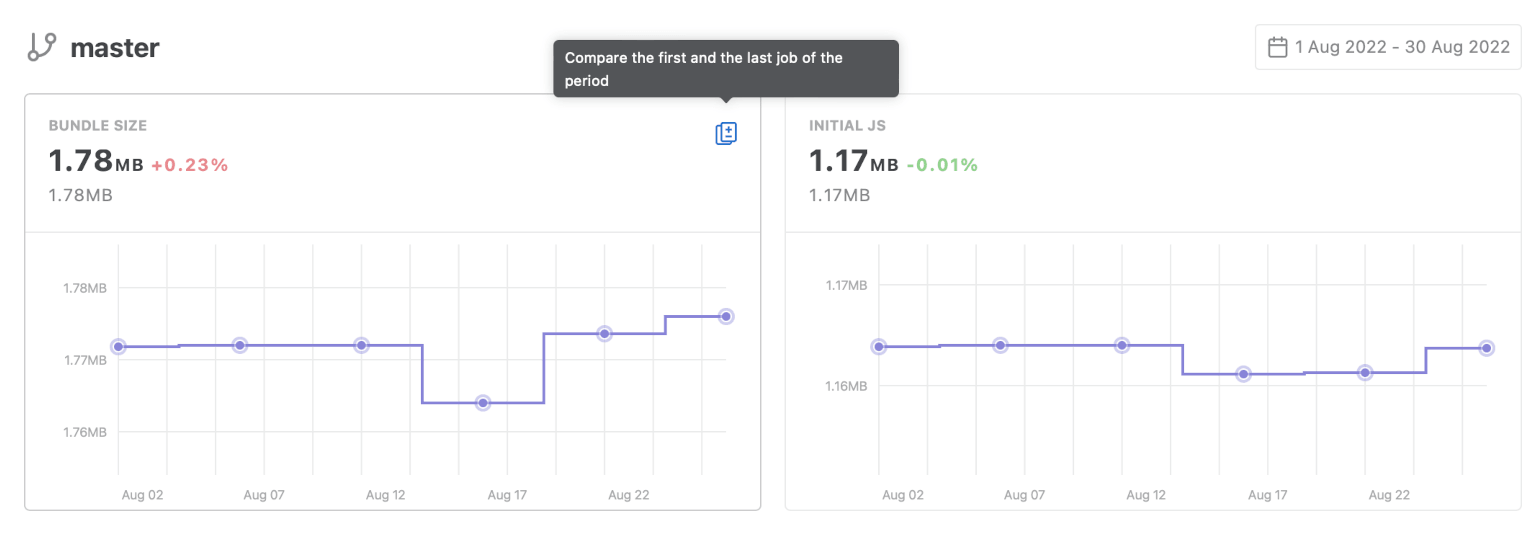
On the metric item hover, a comparison link is visible. Click on the link to navigate to the corresponding metric section of a job comparison between the first and last jobs of the period.

Others
- @relative-ci/agent@4.1.0
- @relative-ci/agent-action@2.1.1
- chore: Upgrade to bundle-stats@4.0.6
- fix: Prevent job view error when the baseline is missing
- feat: Organization usage - show limits
- feat: Project settings - show visibility
- feat: Project settings - show repository details
- fix: Job list - order metrics by change absolute value
- enhance: Job header - consistent UI, move links inside the options menu
Read more
Follow us on Twitter, subscribe to our mailing list or subscribe to our feed to stay up to date with RelativeCI updates.